
This post covers every important balance sheet ratios.
In this article, you will learn:
- What balance sheet ratios are
- liquidity and profitability ratios
- How to calculate ratios
- Formulas and real-life examples.
So, let’s dive into this amazing post.
Balance Sheet Overview
Before delving into ratios, it’s crucial to grasp some basics, such as what a balance sheet is and why it holds significance.
It’s also necessary to understand what a ratio is and which types of ratios we will discuss.
So, let’s begin with a fundamental understanding.
What is balance sheet
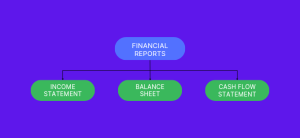
The balance sheet is one of the main financial statements in business reports, alongside the income statement and cash flow statement.
These reports are used to analyze businesses and assess the financial position of the company.
The balance sheet comprises three main parts: assets, liabilities, and equity.
Therefore, the balance sheet provides an overall presentation of all assets owned by the company and all its liabilities, including both short-term and long-term obligations.
Investors and the management team utilize these figures and data to analyze the company and make decisions.
Balance sheet ratios
In simple terms, a ratio involves comparing two values to draw specific conclusions.
In terms of balance sheet ratios, figures and data from the balance sheet report are compared to analyze and make decisions.
By comparing values on the balance sheet, conclusions can be drawn about the company’s performance. This offers a quick and efficient way to understand the financial position and health of the company.
For example, comparing assets with the company’s liabilities reveals how much potential the company has to survive against its debt.
The balance sheet, being one of the main financial statements, is crucial when investors decide where to invest. It provides an overview of the company’s assets and liabilities, essential for the company’s growth.
So, our journey begins here.
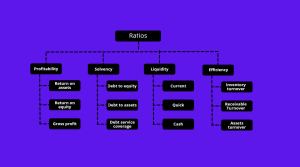
This article covers four categories of ratios based on characteristics, with each section including three main ratios:
- Profitability ratio
- Solvency ratio
- Liquidity ratio
- Efficiency ratio
Now, let’s delve into what each type of ratio entails and the three ratios included in each section.
Profitability Ratios
Profitability ratios gauge a company’s ability to generate profit from its business operations. Three key ratios are considered:
- Return on Equity (ROE)
- Return on Assets (ROA)
- Gross Profit Ratio
Let’s focus on the first one.
Return on Equity (ROE)
This ratio measures the profit generated by the company in comparison to shareholders’ equity.
In simple words, This ratio provides insights into how effectively the company utilises shareholder equity to generate profits.
ROE compares net income to the company’s shareholders’ equity.
Formula:
\text{Return On Equity} = \frac{\text{Net Income}}{\text{Shareholders' Equity}}
Both of these figures can be found in different financial statements. Net income is located at the end of the income statement, while equity is found at the end of the balance sheet.
Example:
Consider Amazon, a well-known provider of online retail services. Here are the figures:
Net Income: $33,364
Shareholders’ Equity: $138,245
Calculate the Return on Equity (ROE) ratio:
ROE = 0.241
In this context, the value of ROE signifies that the company earns 24.1% for every $1 of its share value.
Return on Asset (ROA)
The Return on Asset (ROA) ratio assesses how effectively a company utilises its assets to generate income.
In simpler terms, ROA compares the company’s net income to its total assets, reflecting how efficiently the firm invests in assets to earn money.
Formula:
\text{Return On Assets} = \frac{\text{Net Income}}{\text{Total Assets}}
Similar to the previous balance sheet ratio, you can locate both figures in different financial statements. Net income is found in the income statement, while total assets are typically in the first section of the balance sheet, referred to as assets.
Example:
Consider Amazon’s data:
Total Assets: $420,549
Net Income: $33,364
Calculate the Return on Asset (ROA) ratio:
ROA = 0.08
The Return on Asset (ROA) formula in percentage form is:
ROA (%) = 8%
In this context, the value of ROA (8%) is shown in percentage form, indicating the effectiveness of the firm.
A higher ROA suggests that the company efficiently converts its investments in assets into income.
Gross Profit Ratio
The Gross Profit Ratio is a most important and widely used metric among investors and management teams.
It signifies how much a firm generates in gross profit compared to its total sales, revealing the effectiveness of money generation from selling goods and services.
Formula:
\text{Gross Profit Ratio} = \frac{\text{Gross Profit}}{\text{Total Sales}}
Here, Gross Profit = Net Sales -Cost of Goods and Service
Both figures can be extracted from the income statement.
Example:
Consider figures from Amazon’s income statement:
Gross Profit: $197,478
Total Sales: $469,822
Calculate the Gross Profit Ratio:
Gross Profit Ratio = 0.42
Investors use this balance sheet ratio to assess how effectively a company sells its goods and services.
Other hand, the management team gauges how much money is left out for reinvestment.
A higher Gross Profit Ratio is good, indicating strong business performance.
Now, into the next chapter…
Solvency Ratios
Solvency ratios assess a company’s capability to pay its debts, primarily focusing on long-term obligations.
Let’s delve into the first one:
Debt to Equity Ratio
This financial ratio compares a company’s total debt with its shareholders’ equity.
In simple terms, divide the value of total debt by the value of shareholders’ equity to obtain the debt-to-equity ratio.
This ratio illustrates how robust a company’s capital structure is compared to its liabilities.
Investors use this ratio to analyse whether a firm is sufficiently capable of paying its long-term debts.
Formula:
\text{Debt to Equity Ratio} = \frac{\text{Total Debt (Liabilities)}}{\text{Shareholders' Equity}}
Both values can be found in the balance sheet. Total debt is typically in the second section dedicated to liabilities, and shareholders’ equity is in the third section.
Example:
Consider Amazon’s balance sheet for the year 2022.
Total Debt: $282,304
Shareholders’ Equity: $138,245
Calculate the Debt to Equity Ratio:
D/E Ratio = 2.04
A lower ratio is preferred, as a higher ratio indicates a higher level of company debt, potentially dissuading investors.
Another interpretation is that the firm has $2.04 of debt for every $100 of shareholders’ capital.
Debt to Assets Ratio
The Debt to Assets Ratio is a balance sheet metric that reveals the portion of a company’s assets funded by debt.
This balance sheet ratio compares the total assets of the company to its total debt.
Similar to the Debt to Equity Ratio, the Debt to Assets Ratio is crucial for investors as it provides insights into the company’s standing in terms of its overall financial structure.
It indicates how much debt the company currently holds in relation to its assets, offering an idea of its capacity to manage debt and raise external financial support.
When a company applies for a loan, creditors scrutinise this ratio. A higher ratio may lead to loan rejection as it signals higher risk.
Formula:
\text{Debt to Asset Ratio} = \frac{\text{Total Debt}}{\text{Total Assets}}
Both values are available in the balance sheet. Total debt is found in the second section (liabilities), while total assets are in the first section (Assets).
Example:
Consider Amazon’s balance sheet:
Total Debt: $282,304
Total Assets: $420,549
Calculate the Debt to Asset Ratio:
D/A Ratio = 0.67
D/A Ratio (%) = 67%
This ratio indicates what percentage of Amazon’s assets are funded by debt and showcases its ability to raise debt if necessary.
Debt Service Coverage Ratio
The Debt Service Coverage Ratio is a financial metric that assesses an company’s ability to manage its financial obligations.
It is calculated by dividing the net operating income by the total debt service.
This balance sheet ratio is primarily used in loan approval processes. If the ratio is less than one, it indicates that the firm may struggle to handle its debt.
Formula:
\text{Debt Service Coverage Ratio} = \frac{\text{Net Operating Income}}{\text{Debt Service}}
Here, net operating income is the income before earnings and tax, calculated as
Net operating income = Revenue – Operating Expenses
And debt service comprises the interest and principal amount.
Debt service = Interest + Principal
Both net operating income and debt service can be found in the income statement and balance sheet, respectively.
Example:
Consider the following figures from Amazon:
Net Operating Income: $24,879 (X)
Debt Service: $Y (unknown)
Calculate the Debt Service Coverage Ratio:
\text{DSCR} = \frac{X}{Y}
A higher ratio is favourable, indicating better capability to handle financial obligations, while a lower ratio is a concerning indication.
Liquidity Ratios
Liquidity, in financial terms, refers to a company’s liquid assets, commonly known as cash and cash equivalents.
Liquidity ratios assess a company’s ability to meet its short-term obligations, especially concerning cash.
Current Ratio
The Current Ratio measures a company’s financial position to pay its current or short-term liabilities.
It compares the company’s current assets to its current liabilities.
Current assets include cash, accounts receivable, inventory, and other assets that can be converted into money within a year.
On the other hand, current liabilities represent debts due within one year.
Formula:
\text{Current Ratio} = \frac{\text{Current Assets}}{\text{Current Liabilities}}
Both values are available in the balance sheet, typically under the sections of assets and liabilities.
Example:
Consider Amazon’s balance sheet:
Current Assets: $161,580
Current Liabilities: $142,266
Calculate the Current Ratio:
Current Ratio= 1.14
The value of the ratio indicates how many times the company can cover its short-term obligations.
A lower ratio may signify higher current debt in comparison to current assets, which raising concerns.
Conversely, a higher ratio indicates the organization’s ability to comfortably pay its current liabilities.
In this case, the value of 1.14 reveals how many times the company can cover its debt.
Quick Ratio
The Quick Ratio, also referred to as the Acid-Test Ratio, a metric for evaluating an organization’s capacity to meet its current debts.
Unlike the current ratio, it specifically compares quick assets to quick liabilities.
Quick assets and quick liabilities undergo minor modifications compared to those used in the current ratio.
Quick assets include cash, cash equivalents, and accounts receivable—assets easily convertible to cash. Inventory is omitted due to its longer conversion time.
Quick liabilities comprise current liabilities, excluding specific short-term obligations like bank overdrafts.
Formula:
\text{Quick Ratio} = \frac{\text{Quick Assets}}{\text{Quick Liabilities}}
This ratio provides more accurate analysis for company’s short-term liquidity.
A higher quick ratio is generally favorable, indicating a better ability to cover short-term obligations.
Conversely, a lower ratio may raise concerns about the company’s immediate financial liquidity.
Cash Ratio
The Cash Ratio evaluates a company’s ability to settle its short-term debt obligations using cash and cash equivalents.
This balance sheet ratio compares the company’s cash and cash equivalents to its current liabilities.
This ratio is more specific than the previous ones, focusing on the most liquid assets—cash and cash equivalents.
Cash equivalents include assets easily convertible to cash within 90 days, such as market securities, coins, paper money, preferred stocks, and money orders.
Formula:
\text{Cash Ratio} = \frac{\text{Cash and Cash Equivalents}}{\text{Current Liabilities}}
Most companies present cash and cash equivalents together, although some may provide separate figures.
Regardless, both figures for the formula can be found in the balance sheet, in the assets and liabilities sections.
Example:
Consider the figures from Amazon:
Cash and Cash Equivalents: $42,377
Current Liabilities: $142,266
Calculate the Cash Ratio:
Cash Ratio = 0.3
The ratio indicates how many times the company’s debt is covered by its current liquidity.
A ratio exceeding one may suggest excess cash that is not being utilized for investment, while a ratio of 1:1 means the firm has enough cash to cover its current debt.
If the ratio is less than one, the company may not have sufficient cash and cash equivalents to pay its current debt.
Remember, companies often use cash to expand their business, reaping benefits in the long term.
Now, let’s proceed to the final chapter…
Efficiency Ratios
The Efficiency Ratios chapter comprises three ratios that shed light on how effectively a company utilizes its assets and liabilities, providing insight into overall performance.
Let’s begin with the first one.
Inventory Turnover Ratio
The Inventory Turnover Ratio measures how effectively a company sells its inventory, providing management with insights into the speed and frequency of inventory sales.
Formula:
\text{Inventory Turnover Ratio} = \frac{\text{Cost of Goods Sold}}{\text{Average Inventory}}
Average inventory is calculated as
\frac{\text{Beginning Inventory} + \text{Ending Inventory}}{2}
The cost of goods sold is reported in the income statement at the beginning, while the average inventory is found on the balance sheet.
A lower value of this ratio may indicate that the company has a large quantity of unsold inventory, suggesting a potential lack of demand in the market and inefficiency in selling inventory.
Receivable Turnover Ratio
The Receivable Turnover Ratio provides insights into how swiftly and effectively a company collects cash from customers with outstanding credit.
Formula:
\text{Receivable Turnover Ratio} = \frac{\text{Net Sales}}{\text{Average Receivable}}
Average receivable is calculated as
\frac{\text{Beginning Receivable} + \text{Ending Receivable}}{2}\
Net sales are found in the income statement, while the receivable account is located in the balance sheet’s assets section.
Example:
Consider Amazon’s figures (year 2022):
Beginning Account Receivable: $32,891
Ending Account Receivable: $42,360
Net Sales: $469,822
Calculate the Receivable Turnover Ratio:
Receivable Turnover Ratio = 12.48
A lower ratio may indicate that the company is not collecting cash promptly, suggesting that receivables are stuck in outstanding credits—a less favorable indicator.
Assets Turnover Ratio
The Assets Turnover Ratio reveals how effectively a company utilizes its assets to generate net sales or revenue.
The Assets Turnover Ratio compares the net sales of a company to its total assets
Formula:
\text{Assets Turnover Ratio} = \frac{\text{Net Sales}}{\text{Total Assets}}
Net sales can be found in the income statement, while total assets are listed in the balance sheet.
Example:
Consider Amazon’s figures:
Net Sales: $469,822
Total Assets: $420,549
Calculate the Assets Turnover Ratio:
Assets Turnover Ratio = 1.12
A lower ratio may suggest that the company is not efficiently using its assets to generate revenue.
However, a higher ratio does not necessarily indicate a positive situation; it could imply that the company has fewer assets.
Conclusion
In summary, when it comes to understanding how a company is doing, it’s not enough to rely on just one ratio. Experts suggest looking at various ratios to get a full picture.
In our discussion, we talked about four important types of ratios.
Each gives us a different angle to look at a company’s financial health.
Now, I want to hear from you! Which Balance sheet ratios do you think are most helpful when checking a company’s performance?
Share your thoughts in the comments below. Let’s chat about financial ratios!